Server monitoring is an important aspect of infrastructure monitoring which is required to ensure optimal performance, minimizing downtime, and maintaining security. Businesses risk data loss, poor user experience, and financial setbacks without proper server monitoring solutions in place.
However, challenges like unexpected downtime, performance bottlenecks, and security vulnerabilities make effective server monitoring complex. Further, identifying issues in real-time, analyzing vast amounts of data, and ensuring system scalability are some other challenges that need to be addressed by the monitoring solution.
Server Monitoring Tools Comparison
| Tools | Alerting Capabilities | Key Features |
|---|---|---|
| Paessler PRTG | Custom alerts and notifications | Preconfigured sensors, monitors virtual environment |
| Prometheus | Flexible PromQL based alerts | Powerful queries using PromQL, efficient metrics storage |
| Grafana | Custom alerting based on PromQL | Insightful graphs and visualization, explore data using ad-hoc queries |
| Zabbix | Flexible alerts using custom triggers | Extensive integration support using templates, flexible triggers expressions |
| Nagios Core | Include email, SMS, and audible alerts. | Network host hierarchy, proactive problem resolution using event handlers |
| Icinga | Flexible alerting system, notifications via email, IRC, Slack etc. | Extensible with plugins, manages infrastructure using single interface |
| LibreNMS | Custom alerts and notifications | Network auto- discovery, native mobile app support |
| Checkmk | Custom alerts and notifications | Flexible server monitoring using smart checks, native agents for many OS |
| Cacti | Custom alerts and notifications | Scalable graph-based monitoring, extensive SNMP support |
1. Paessler PRTG: Offer 100 Sensors Free for Life
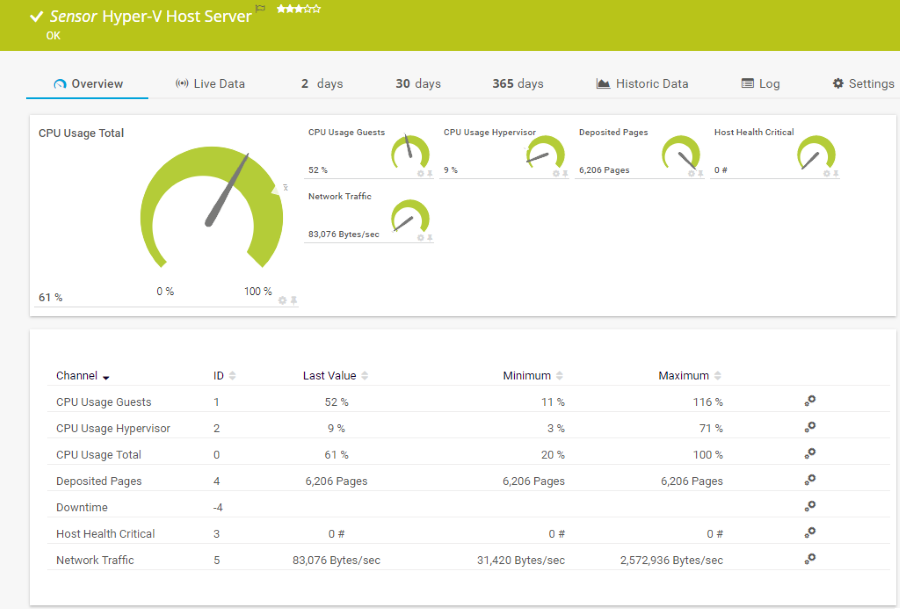
Paessler PRTG provides free server monitoring solution to track uptime, health, disk space, and performance 24/7 of your infrastructure. I like that it helps you to easily identify issues using a central dashboard and get notified with real-time alerts via SMS, email, and more.
Why Use Paessler PRTG?
- Supports custom alerts and data visualization for server and hardware metrics
- Monitors key health parameter of your servers like hardware status, disk space, CPU load etc.
- Monitors your web servers and websites on the availability, traffic, and processes of your web pages
- Comes with preconfigured sensors for the most popular server hardware manufacturers
- Supports monitoring your virtual environment like VMware, Citrix, or Microsoft Hyper-V
Note
Paessler PRTG is trusted by names like Pepe Jeans, 7 Eleven, Virginia Tech, Bosch, Siemens, Skyscanner etc. for their monitoring needs.
Paessler PRTG Limitations
- Limited Log Analysis – Avoid it if you require deep log analysis or advanced AI-driven insights, as it focuses more on sensor-based monitoring.
Paessler PRTG Free Features
- 100 sensors free for life (10 sensors required on average per device)
- Auto-discovery function to automatically incorporate devices into monitoring
- Alerting, reporting, ticketing, and network mapping features
- Monitoring of hardware, software, network performance, data traffic
Use Paessler PRTG when you require an easy-to-set-up, sensor-based solution with real-time insights and customizable alerts.
2. Prometheus: Open-Source Metrics and Alerting Solution
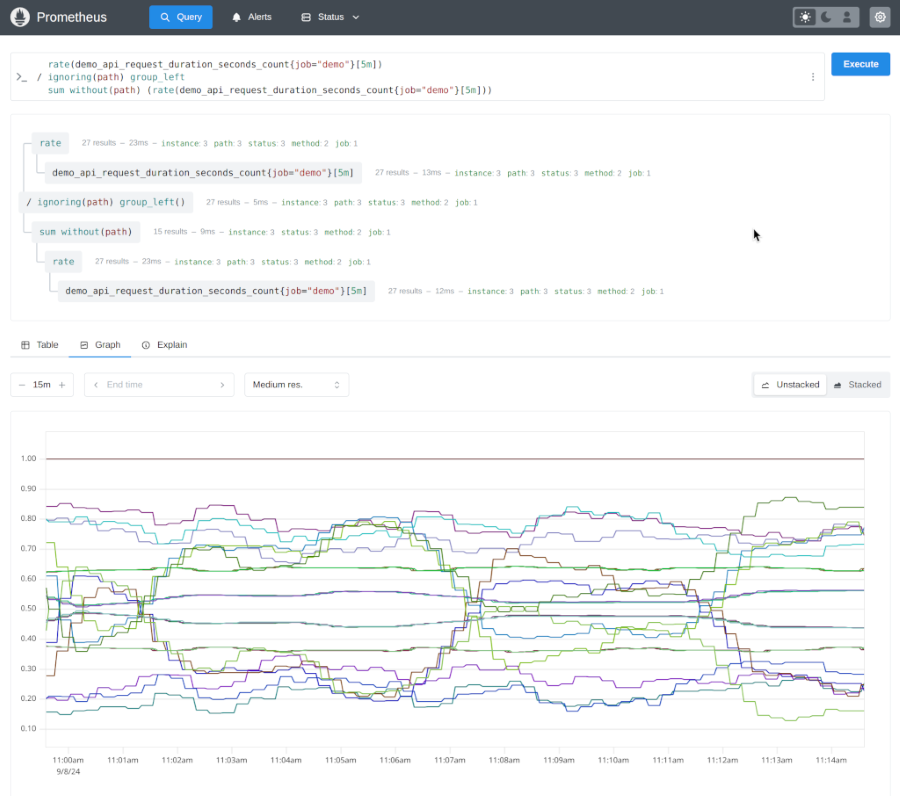
Prometheus is a popular, open-source, community-driven monitoring and alerting system
which collects and stores its metrics as time series data, i.e., metrics information is stored with the timestamp at which it was recorded, alongside optional key-value pairs called labels.
Why Use Prometheus?
- Supports powerful queries using PromQL to generate ad-hoc graphs, tables, and alerts
- Supports multiple modes for visualizing data: a built-in expression browser, Grafana integration, and a console template language
- Stores data in an efficient custom format where each server is independent for reliability
- Alerts are defined based using PromQL and maintain dimensional information
- Client libraries allow easy instrumentation of services
Note
Prometheus customers include CoreOS, DigitalOcean, Docker, Ericsson, Grafana Labs, SoundCloud etc.
Prometheus Limitations
Not for Precise Metrics – Avoid it if you need 100% accuracy, such as for per-request billing, as the collected data will likely not be detailed and complete enough.
Prometheus is ideal for time-series data, infrastructure metrics, and dynamic environments like Kubernetes.
3. Grafana: Best Data Visualization and Monitoring for Modern Infrastructure
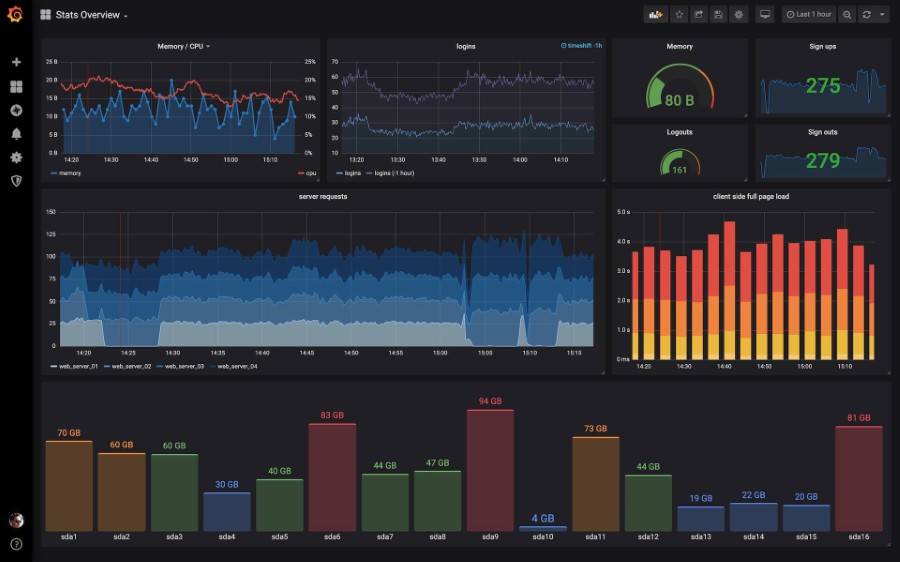
Grafana Open Source Software (OSS), the popular visualization platform enables you to query, visualize, alert on, and explore your metrics, logs, and traces wherever they’re stored. Its data sources plugins can query data sources including time series databases like Prometheus and CloudWatch, logging tools like Loki and Elasticsearch, NoSQL/SQL databases like Postgres, CI/CD tooling like GitHub etc.
Why Use Grafana?
- Supports plotting data on live dashboards with insightful graphs and visualizations
- Helps explore your data through ad-hoc queries and dynamic drilldown
- Supports annotating graphs with rich events from different data sources
- Allows creating dashboards that can be reused for different use cases
- Provides hundreds of community developed dashboards and plugins from its official library
Note
Grafana is used and trusted by brands including Wells Fargo, Dell, Altassian, Roblox, DHL, Nvidia, Adobe, Microsoft, Cisco, Slack etc.
Grafana Limitations
- High Resource Usage – Can consume significant memory and CPU, especially with large datasets.
- Limited Log Analysis – Not as powerful as ELK or Splunk for deep log searches.
Grafana Free Features
Grafana OSS is completely free to download and use on your self-hosted environment but excludes some enterprise data source plugins and additional features found in the Enterprise version. Grafana Cloud, a managed instance of Grafana includes following free features (per month):
- Metrics 10k metrics billable series, 14 days retention
- Visualization 3 active users with Enterprise plugins
- Logs, Traces, Profiles 50 GB each, 14 days retention
I would recommend Grafana if you need real-time visualization, alerting, and analysis of metrics from multiple data sources like Prometheus, InfluxDB, or Loki.
4. Zabbix: Secure Monitoring with Traffic Encryption, LDAP Authentication
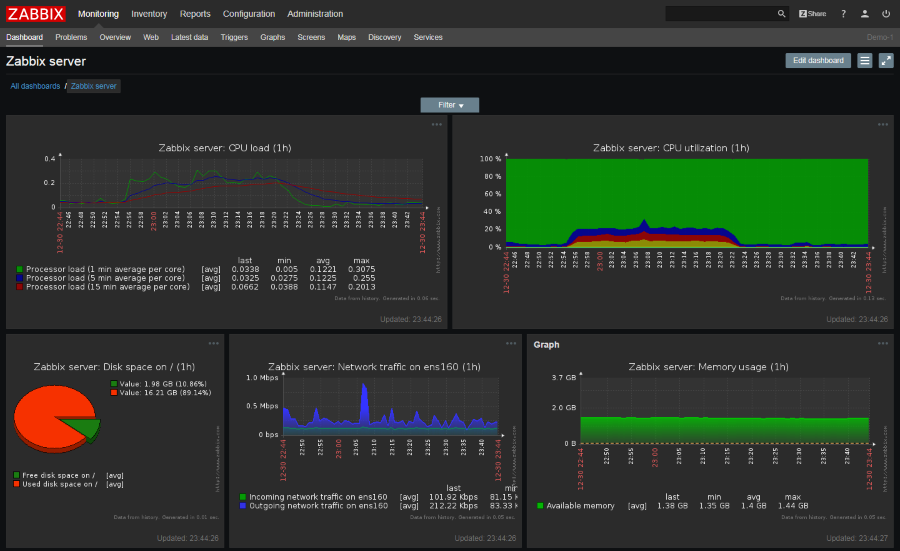
Zabbix offers you to monitor most server performance metrics and incidents. It can monitor metrics for server performance like “high CPU or memory utilization”, server availability like “power supply state” and configuration changes like “firmware upgrades”. I like its custom dashboards and alerting capabilities with wide availability of ready-made templates provided by the Zabbix community.
Why Use Zabbix?
- Supports out-of-the-box templates to monitor all popular servers & OS
- Supports various data collection methods and protocols like SNMP, IPMI, IPv6 etc.
- Autodetect network devices and device configuration changes
- Supports flexible trigger expressions using complex logical expressions
- Helps detect root cause failures by defining multi-level dependencies between related nodes
- Can predict network downtimes and bandwidth trends with proactive network monitoring
Note
Zabbix customers include Dell, European Space Agency, NTT, Navisite, GlobeNet, ARI Network Services etc.
Zabbix Limitations
- Resource-constrained Environment– Avoid Zabbix if you need lightweight monitoring for resource-constrained environments or require highly scalable cloud-native monitoring with built-in automation and dynamic discovery.
Use Zabbix when you need a powerful, open-source monitoring solution with extensive customization, real-time alerts, and support for on-prem, cloud, hybrid environments.
5. Nagios Core: Flexible Distribution Options for Developers and Open Source Enthusiasts
Nagios Core is an open-source monitoring solution that supports monitoring for all environments, small and large. It works with Nagios Plugins to provide comprehensive monitoring of websites, servers, network switches, routers, firewalls, ports, applications, metrics, and more.
Why Use Nagios Core?
- Supports monitoring of host resources (processor load, disk usage, etc.) and network services (SMTP, POP3, HTTP, NNTP, PING, etc.)
- Allows users to easily develop their own service checks using a simple plugin design
- Ability to define network host hierarchy using “parent” hosts, allowing detection of and distinction between hosts that are down and those that are unreachable
- Ability to define event handlers to run during events for proactive problem resolution
- Optional web interface for viewing current network status, problem history, log file, etc.
Nagios Core Limitations
- Limited Monitoring with Basic UI – Avoid Nagios Core if you need a modern UI with built-in analytics or deploying it for large-scale environments due to complex configurations and high resource consumption.
I would suggest Nagios Core when you need a free, flexible, and highly customizable monitoring solution for small to medium-sized infrastructures.
6. Icinga: Best for Monitoring SSH, TCP, UDP, and Other Protocols
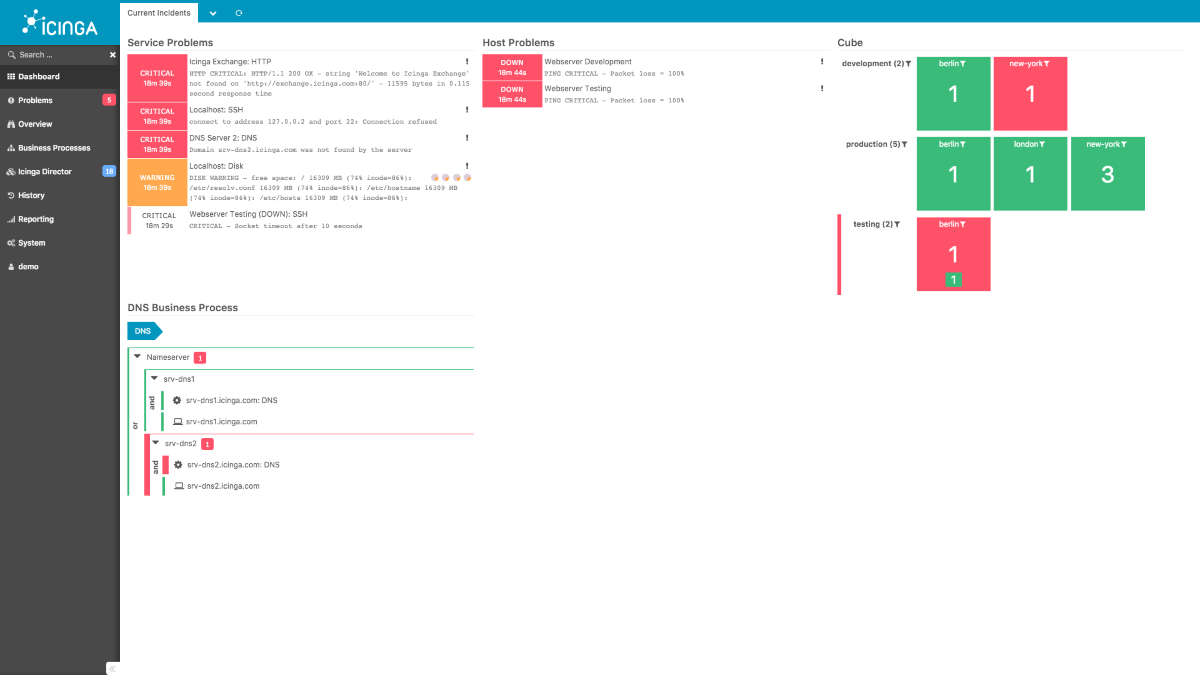
Icinga offers a flexible, scalable open-source solution for server monitoring for both on-premise, hybrid and cloud servers. I like how it supports monitoring many different operating systems including all major distributions of Linux, Unix and Windows.
Why Use Icinga?
- Shows your distributed infrastructure in one single interface
- Supports both agent-based and agentless monitoring
- Can monitor the hardware of physical servers
- Extensible with your own monitoring checks and plugins
- Monitors your heterogenous infrastructure with a single monitoring tool
Note
Icinga customers include ING, Koofr, University of Bern, Rhode & Schwarz, Photowatt etc.
Icinga Limitations
- Unsuitable for Small-scale Monitoring – Might not be suitable for environments where quick, lightweight monitoring solutions are needed.
Use Icinga for large-scale environments requiring robust, customizable monitoring with extensive alerting and reporting features.
7. LibreNMS: Open-Source Network and Server Monitoring with Auto-Discovery
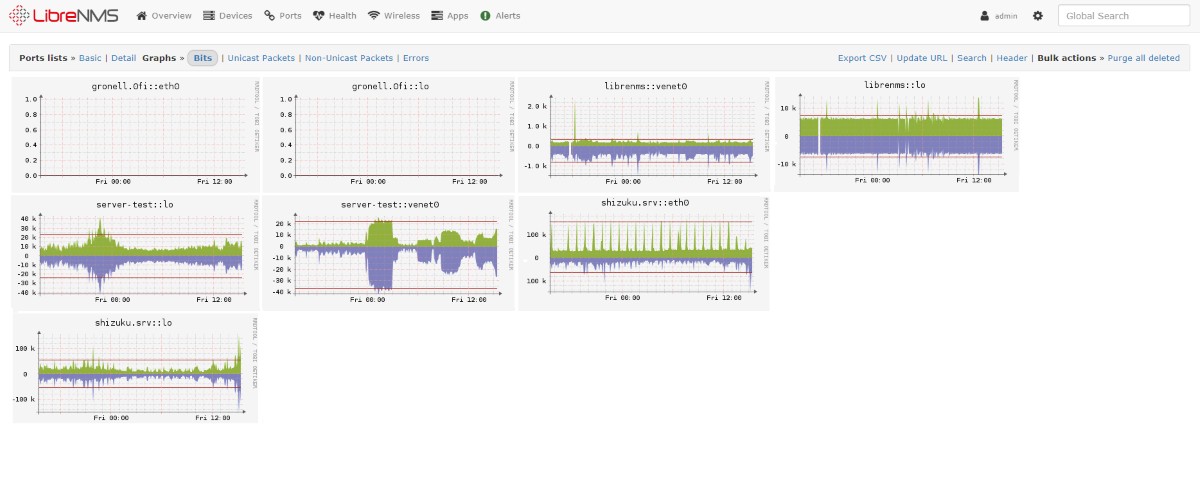
LibreNMS is a fully featured, open-source network monitoring system that provides a wealth of features and device support. I especially like its offering of native phone apps for both iPhone and Android platforms.
Why Use LibreNMS?
- Can auto-discover your entire network using CDP, FDP, LLDP, OSPF, BGP, SNMP and ARP
- Provides API to manage, graph and retrieve data from your install
- Supports generating bandwidth bills for ports on your network based on usage or transfer
- Supports horizontal scaling to grow with your network
- Has mobile friendly Web UI with native app support
- Provides highly flexible alerting system while supporting notifications via email, IRC, slack etc.
Note
LibreNMS is sponsored and used by i4Networks, GambleDex, ncubed, WaveDirect etc.
LibreNMS Limitations
- Limited Windows Support – Avoid LibreNMS when you primarily manage Windows servers, as it’s better suited for network gear and Linux systems.
Use LibreNMS when you need a free, open-source solution for monitoring network devices and Linux servers in environments that rely heavily on SNMP.
8. Checkmk: Offers Agent-based Monitoring for Windows, Linux, and Other OS
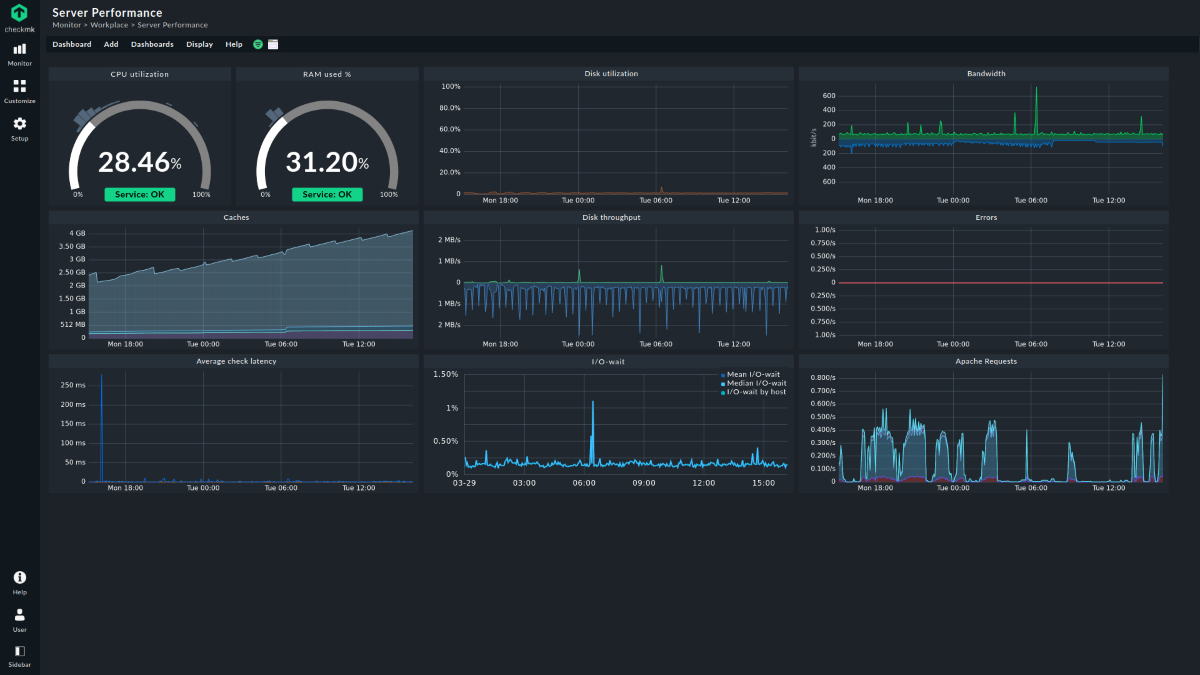
Checkmk is a scalable server monitoring software which supports monitoring of almost every operating system and can easily scale horizontally. I like how quickly you can get started with its easy and fast setup process.
Why Use Checkmk?
- Supports monitoring any type of server (web, mail, database servers etc.)
- Includes more than 2,000 smart checks for flexible server monitoring
- Supports auto-discovery and network mapping
- Provides native agents for Windows, Linux and many more operating systems
- Supports agentless monitoring with SNMP and TCP/UDP (FTP, LDAP, IMAP etc.)
- Can intelligently discover metrics to monitor on server without additional configuration
Note
Checkmk is used and trusted by some big names like Adobe, HP, Fujitsu, Orange, Cloudera, NEC, ING, Capgemini, Siemens etc.
Checkmk Limitations
- Small Environments – It might be overkill for businesses with only a few servers, as simpler tools might be more cost-effective and easier to manage.
Checkmk Free Features
Checkmk Raw version is offered free-of-charge as an open-source IT monitoring for small infrastructures. Its features include:
- Auto-discovery of nodes
- Monitor out-of-the-box with 2000+ plug-ins
- Auto-detect issues in your IT
Checkmk excels in monitoring large, heterogeneous environments with various operating systems, applications, and network devices.
9. Cacti: Server Monitoring with Graphical Representation
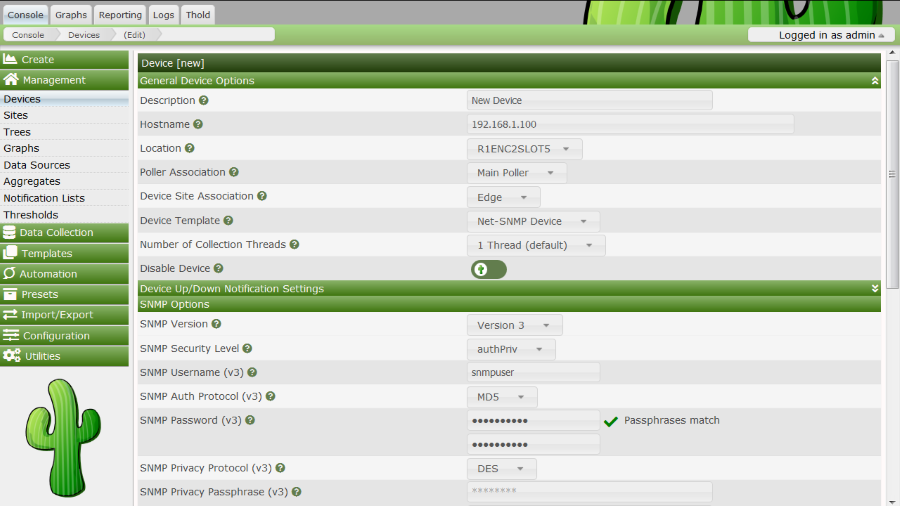
Cacti is a performance and fault management framework and a frontend to RRDTool, which is a Time Series Database (TSDB). It stores all of the necessary information to create performance management Graphs in either MariaDB or MySQL and then leverages its various Data Collectors to populate RRDTool based TSDB with that performance data.
Why Use Cacti?
- Supports SNMP, ICMP, TCP and UDP availability checking
- Creates RRDTool graph using all of the standard RRDTool graph types
- Supports offline caching in the case of a network interruption using Remote Data Collectors
- Provides multiple template types including Device, Graph, Data Source, Aggregate, and Color
- Provides automated scheduling of network scans to discover SNMP enabled devices
- Cacti is extendable with plugins into other operational aspects within organization
Cacti Limitations
- Real-Time Monitoring – Cacti should not be used for server monitoring when real-time monitoring is required, as its polling interval can cause delays.
- Complex Alerting – Not so suitable for environments that need extensive custom alerting or complex, dynamic dashboards.
Cacti Free Features
Cacti is open-source and is free to download and use in any environment with all its features. Cacti requires MySQL, PHP, RRDTool, net-snmp, and a webserver that supports PHP such as Apache or IIS.
I would recommend Cacti when you need a scalable, graph-based solution for long-term performance data collection. It’s also useful for environments where SNMP-based monitoring and detailed historical data analysis are key priorities.
Honorable Mentions
Conclusion
In conclusion, choosing the right server monitoring solution depends on your specific needs, whether it’s real-time monitoring, customizable dashboards, or AI-driven insights. From free server monitoring tools like Prometheus and Grafana to proprietary monitoring software with advanced features, each tool offers some unique benefits.
By leveraging the above free server monitoring software, you can ensure optimal server performance, minimize downtime, and gain deep performance insights for your infrastructure.
