Kubernetes is a popular standard for container orchestration in the industry. It has revolutionized how organizations deploy and manage applications at scale.
As businesses increasingly move towards cloud-native technologies, effective Kubernetes monitoring solutions have become all the more essential to ensure optimal performance, security, and reliability of your containerized workloads. It helps to identify bottlenecks, manage resources efficiently, and secure sensitive data, making it indispensable for maintaining robust and scalable cloud-native infrastructures.
In this article, we will explore the top Kubernetes monitoring tools including open source, free and premium options, highlighting their features, benefits, and limitations.
1. Elastic Observability: Unified Logs, Metrics & APM for Kubernetes
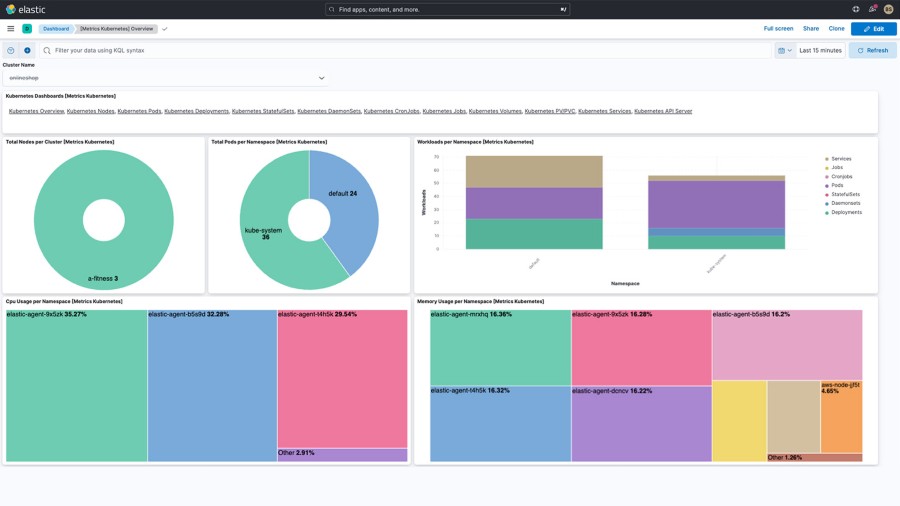
Elastic Observability helps you monitor logs, metrics, and traces from your Kubernetes cluster along with the workloads running on it, into a single, unified solution. I like its dynamic service discovery, and central agent management features that allow you to quickly identify issues within your environment.
Why Use Elastic Observability?
- Supports automatic discovery of dynamic workloads with out-of-the-box dashboards
- Supports open standards like OpenTelemetry, Prometheus, and Istio along with PromQL
- Correlates application services to the related Kubernetes and cloud components
- Provides deep insights into your Kubernetes cluster and the services running on it
- Includes machine learning-based anomaly detection
Note
Elastic Observability is trusted by names like Wells Fargo, Adobe, Booking.com, BMW, Cisco, Comcast etc.
Elastic Observability Limitation
- Resource Usage – Avoid if you require a lightweight, low-overhead solution, as it can be resource-intensive.
- Cloud-native Monitoring – Skip if you need seamless out-of-the-box integration with cloud-native monitoring stacks like AWS CloudWatch or Google Cloud Operations.
Elastic Observability Pricing
Elastic Cloud Hosted is a public cloud managed service available on AWS, Azure, and Google Cloud whose pricing starts at $95/month.
Use Elastic Observability if you require a scalable, customizable solution that integrates well with the Elastic Stack (ELK) for advanced observability and security.
2. Prometheus: Open-Source Kubernetes Monitoring
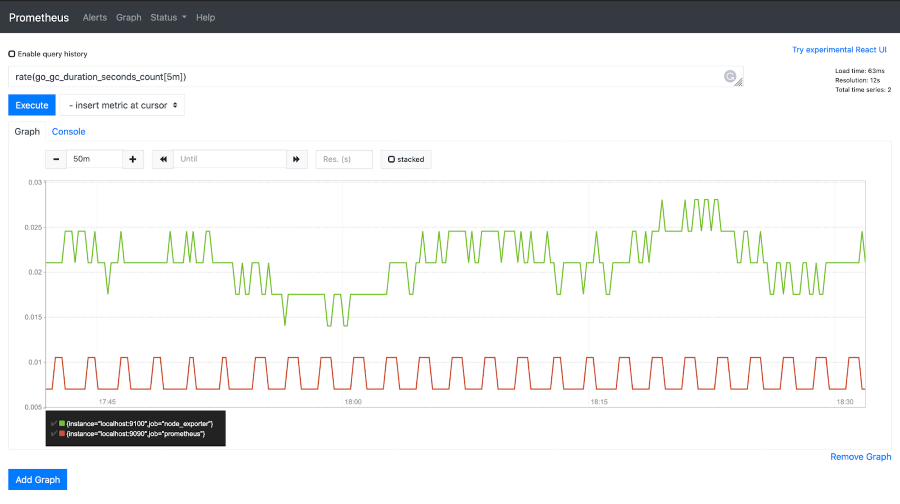
Prometheus is a popular, open-source monitoring and alerting system which uses kube-prometheus, an open-source repository, to provide easy to operate end-to-end Kubernetes cluster monitoring using the Prometheus Operator. I like its powerful querying and alerting capability using PromQL, which integrates well with Kubernetes.
Why Use Prometheus?
- Allows powerful queries using PromQL to generate graphs, tables, and alerts
- Supports multiple modes for visualizing data
- Supports efficient custom format to store data
- Allows defining alerts using PromQL
- Supports client libraries that allows easy instrumentation of services
Note
Prometheus customers include CoreOS, DigitalOcean, Docker, Ericsson, Grafana Labs, SoundCloud etc.
Prometheus Limitations
- Long-term Storage – Avoid if your cluster has extreme scale (>100k series per node) or requires long-term storage without additional complexity.
Use Prometheus when you need an open-source, highly customizable solution with powerful querying (PromQL) and alerting capabilities.
3. New Relic: AI-Powered Proactive Kubernetes Health & Capacity Monitoring
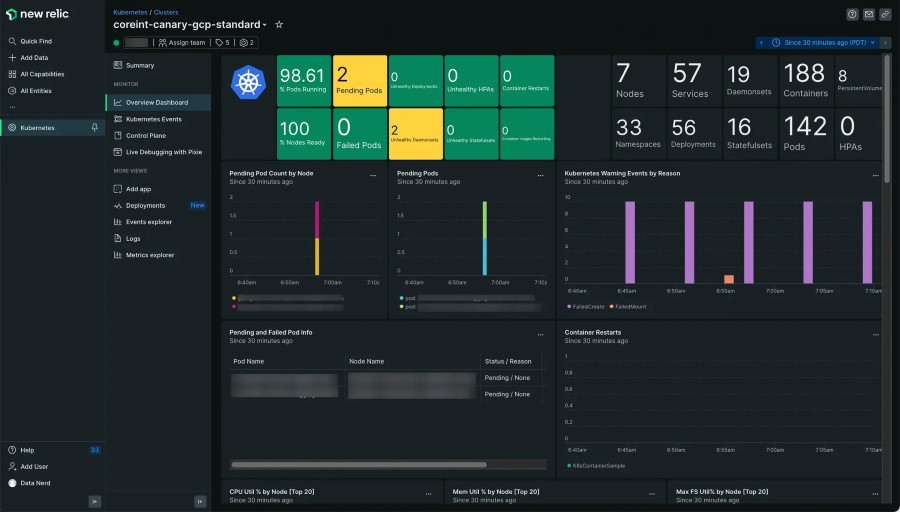
New Relic gives you visibility into your Kubernetes clusters and workloads with easy setup which works well for either hosted on-premises or in the cloud clusters.
Why Use New Relic?
- Gives you end-to-end observability across your clusters
- Provides dashboards to proactively monitor your metrics
- Provides dashboards with interactive visualizations that let you easily explore your data
- Supports integrating alerts with your favorite tools (like Slack, PagerDuty, etc.)
- Includes cluster explorer with multi-dimensional representation of a Kubernetes cluster
Note
New Relic powers monitoring for customers including Verizon, Toyota, Adidas, Shutterstock, Zenhub etc.
New Relic Limitations
- Cost Considerations – Avoid if cost is a concern, as its pricing can be high for large-scale clusters.
- On-premise Hosting – Skip if you require full control over data privacy and on-premise storage, self-hosted solutions like Prometheus may be a better fit.
New Relic Pricing
New Relic offers a perpetual free version with 100 GB data ingest and automatic logs obfuscation. Its pricing starts at $0.35/GB beyond the free 100 GB limit for its paid tier.
Use New Relic when you need a fully managed, scalable observability solution with AI-driven insights and real-time anomaly detection, without managing complex monitoring infrastructure.
4. Grafana: Full-Stack Kubernetes Observability & Cost Insights
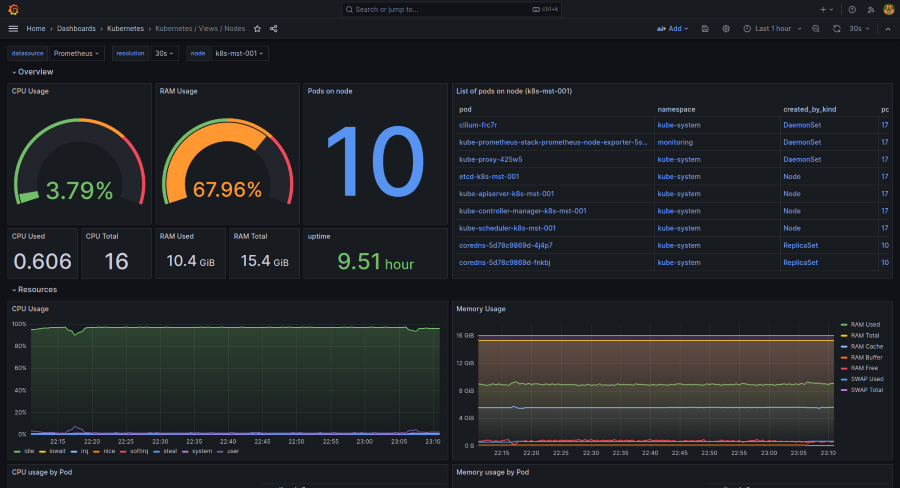
Grafana, a popular, open-source solution, enables you to query, visualize, alert on, and explore your metrics, logs, and traces of your Kubernetes cluster, wherever they’re stored.
Why Use Grafana?
- Supports easy deployment using Helm chart on any of the major cloud-managed Kubernetes services and Kubernetes distributions
- Provides a cluster navigation view to quickly identify and resolve issues
- Gives insight into your Kubernetes costs, spending trends, and potential savings with the cost monitoring feature
- Allows easy identification of fleet issues with an overall snapshot of all your infrastructure components
- Provides detailed insights at every infrastructure level with historical trends
Note
Grafana is used and trusted by brands including Wells Fargo, Dell, Atlassian, Roblox, DHL, Nvidia, Adobe, Microsoft, Cisco, Slack etc.
Grafana Limitations
- Minimal Setup – Avoid if you require a lightweight, out-of-the-box solution with minimal setup, as Grafana requires Prometheus or another data source.
Grafana Free Features
Grafana OSS is completely free to download and use on your self-hosted environment but excludes some enterprise data source plugins and additional features found in the Enterprise version. Grafana Cloud, a managed instance of Grafana, includes the following free features (per month):
- Metrics 10k metrics billable series, 14 days retention
- Visualization 3 active users with Enterprise plugins
- Logs, Traces, Profiles 50 GB each, 14 days retention
I would recommend Grafana if you need real-time visualization, alerting, and analysis of metrics from multiple data sources like Prometheus, InfluxDB, or Loki.
5. Netdata: Best for Small Container Environment
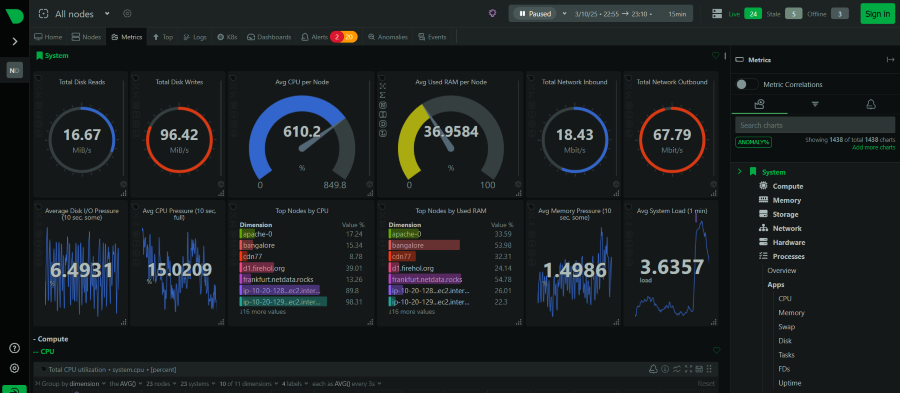
Netdata is an open-source, cloud-based solution for Kubernetes monitoring with high-fidelity data, real-time visualizations, reliable alerts, and anomaly detection for every metric.
Why Use Netdata?
- Netdata Agent is relatively light on CPU and RAM resource usage
- Supports troubleshooting issues in real-time with 1-second latency, 1-second granularity data
- Agent is easy and quick to setup and includes auto-updates while supporting hundreds of integrations
- Scores well on data privacy as your data is stored at its source
- Has an active and vibrant open-source community and is one of the top starred projects on the CNCF landscape
Netdata Limitations
- Long-term Data Retention – Avoid if you need long-term data retention or centralized analytics for complex environments.
Netdata Pricing
Netdata Community is an open-source monitoring platform that you can use for free for max 5 active connected nodes, max 1 active custom dashboard (per Room) which can be securely accessed from anywhere. Its paid plans include Homelab, Business and Enterprise On-Premise with price starting from $4.50 per node/month for Business edition.
Use Netdata when you need real-time, high-resolution metrics with minimal setup and low resource overhead.
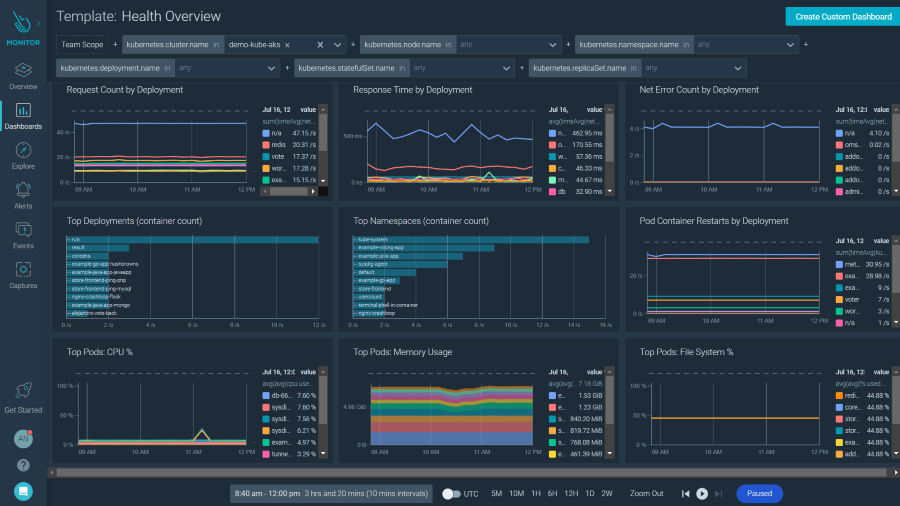
6. Datadog: Full-stack Observability Platform
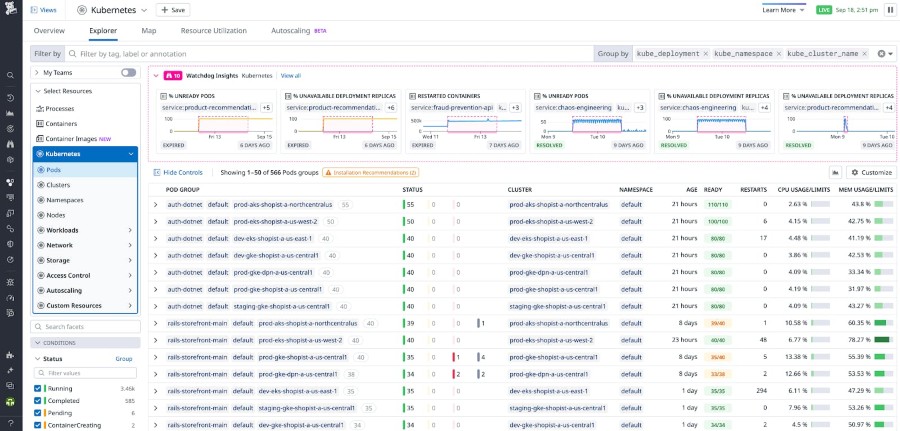
Datadog gives you complete visibility into the health, performance, and security of your Kubernetes environment. I like its customizable dashboards and support for 850+ partner-backed integrations.
Why Use Datadog?
- Suggests insights with machine learning-driven tools like forecasting and anomaly detection
- Provides multi-dimensional workload scaling recommendations and automation
- Can automatically detect and monitor services running in Kubernetes clusters
- Supports automatic correlation of observability data from various Kubernetes components
- Allows autoscaling based on the real-time values of any custom metrics
- Integrates into an organization’s production environment for full-stack threat detection
Note
Datadog is used by brands like Asana, Lenovo, Hearst, Nasdaq, Nielsen etc.
Datadog Limitations
- Pricing – Avoid if cost is a major concern, as its pricing scales quickly with high-metric workloads.
- Data Storage – Skip if you require full control over data storage and compliance, a self-hosted or open-source alternative may be better.
Datadog Pricing
You can start free with Datadog infrastructure monitoring for core collection and visualization features (1-day metric retention for up to 5 hosts). Its pricing otherwise starts at $15/host/month and depends on type of monitoring and usage involved.
Use Datadog when you need a fully managed, scalable solution with deep observability, including logs, metrics, and traces in one platform.
7. Sysdig: Kubernetes Security & Runtime Threat Detection
Sysdig helps you inspect every aspect of your Kubernetes clusters, from capacity to control plane, showing you a prioritized list of issues with curated remediation steps and live logs. I like their detailed dashboards and out-of-the-box alerts.
Why Use Sysdig?
- Prioritizes the vulnerabilities, misconfigurations, permissions, and threats for your environment
- Helps troubleshoot difficult issues like Crash Loop Back Offs, pod evictions, resource allocation
- Shows status of your Kubernetes clusters and possible over-allocations or underutilizations
- Identifies workloads running at any given point in time and deployments having problems
- Shows your workloads with an eye on the requests and limits you have set in your environment
- Allows to set proactive alerts to avoid slowdowns and performance issues
Note
Sysdig is chosen as their monitoring tool by brands like T-Mobile, Booking.com, IBM, Goldman Sachs, Experian, Calendly, Comcast, SAP Concur etc.
Sysdig Limitations
- Fully Open-Source Platform – Avoid if you prefer a fully open-source solution without commercial dependencies.
- Deployment Overhead – Skip if your environment is very small and simple, the overhead of deploying and managing Sysdig might be unnecessary.
Sysdig Pricing
Sysdig offers custom pricing, for which you can request a quote by contacting their sales team.
8. Zabbix: Open-Source Monitoring Tool
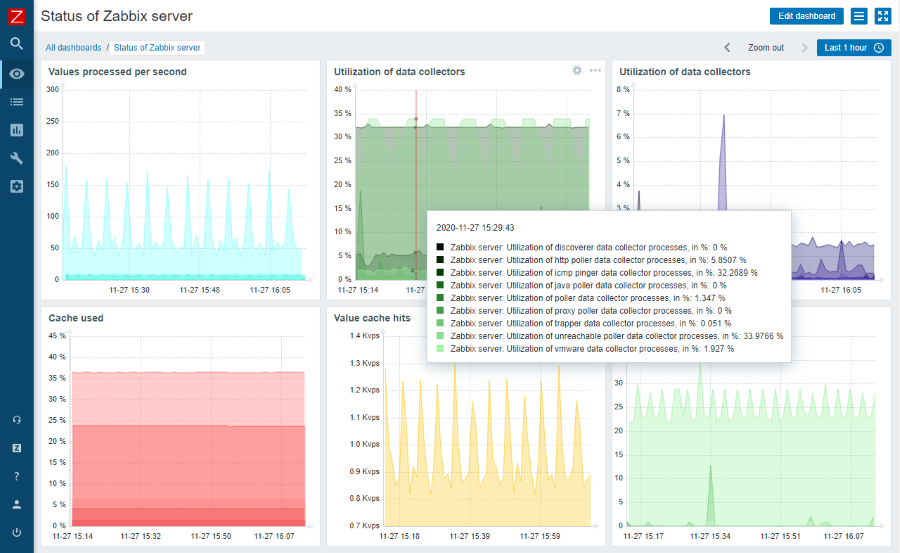
Zabbix provides a powerful automated solution for monitoring the Kubernetes cluster components, which you can deploy using Zabbix Helm Chart with Zabbix Proxy and Zabbix agents. I like its custom dashboards and alerting capabilities, with the wide availability of ready-made templates provided by the Zabbix community.
Why Use Zabbix?
- Autodetects network devices and device configuration changes
- Predicts network downtimes and bandwidth trends using proactive network monitoring
- Supports out-of-the-box templates to monitor all popular OS
- Supports numerous data collection methods and protocols like SNMP, IPMI, IPv6 etc.
- Allows flexible trigger expressions using complex logical expressions
Note
Zabbix is trusted by customers like Dell, European Space Agency, NTT, Navisite, GlobeNet, ARI Network Services etc.
Zabbix Limitations
- Deep Insights – Avoid if you need deep Kubernetes-native insights, such as pod-level metrics, dynamic auto-discovery, and real-time scaling, which tools like Prometheus and Grafana handle better.
I would recommend Zabbix when you need centralized monitoring across hybrid infrastructure, including VMs, bare metal, and cloud services, alongside Kubernetes.
9. Cilium: eBPF-based Network Observability
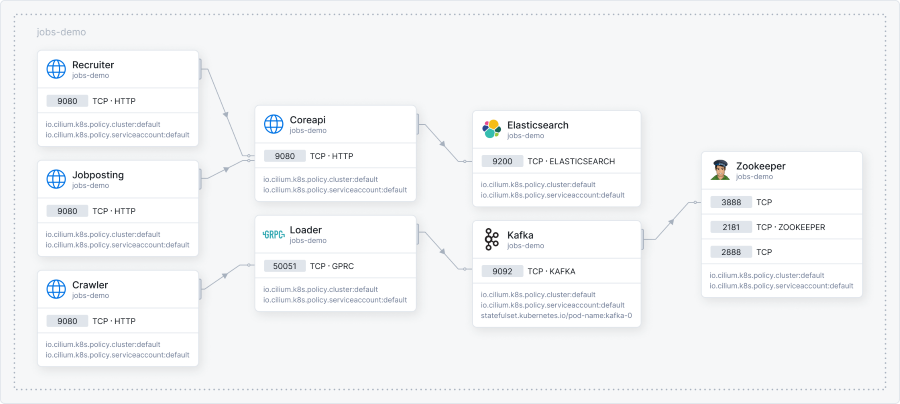
Cilium is an open-source project that provides networking, security, and observability for cloud-native environments using eBPF technology. As an open-source solution, it is freely available for use.
Why Use Cilium?
- Provides real-time visibility into Kubernetes clusters, capturing flow, policy, and DNS events
- Enables collection of detailed metrics for connectivity, security, and traffic flows
- Integrates with Prometheus, Grafana, and Datadog for visualization and anomaly detection
- Offers granular insights into pod-to-pod traffic with identity-aware Layer 3/4/DNS flow logs
- Monitors Layer 7 protocols like HTTP and gRPC for fine-grained observability
Note
Cilium is used by organizations that include Adobe, DigitalOcean, AWS, Azure, Datadog, eBay, Google, GitLab etc.
Cilium Limitations
- Non-Linux Environments or Older Linux Kernels – Cilium relies on eBPF, which is only fully supported on newer Linux kernels, which makes it unsuitable for Windows nodes or older Linux versions.
Use Cilium for clusters requiring advanced network policies, service mesh capabilities, and deep visibility into network traffic.
Noteworthy Kubernetes monitoring options…
Conclusion
Kubernetes monitoring is more critical than ever with the increasing complexity of cloud-native applications. The tools highlighted in this article offer a range of features from real-time metrics and log aggregation to security and resource optimization.
Whether you’re looking for open-source solutions like Prometheus and Grafana or comprehensive platforms like Datadog and New Relic, there’s a Kubernetes monitoring tool to suit every need. By leveraging these tools, organizations can ensure their Kubernetes environments are secure, efficient, and scalable, positioning them for success in the rapidly evolving IT landscape.